Reasoning about performance from first principles
When trying to optimize performance on a computer, we can simplify the hardware into two things [1]
- some number of compute execution units with a fixed number of maximum possible floating point operations per seconds (FLOPS/s)
- memory bus that can move a fixed number of bytes/s into the compute units.
For the RTX 3090 this is around 35.5 TFLOPs with a max global memory bandwidth of 936 GB/s. We can idealize the program running on the computer as loading K bytes and performing N operations with each byte, giving us the arithmetic intensity. When trying to understand what the upper bound of tasks that can be performed per second, we can use the equation below.
$$P = \min\left(\frac{\text{flop}}{s}, \frac{N}{K} \times \frac{\text{bytes}}{s}\right)$$
By multiplying the memory bandwidth by the arithmetic intensity we adjust for the fact that each loaded byte results in K operations. The resulting number P is the minimum of the memory bandwidth (adjusted for arithmetic intensity) and the theoeretical FLOPS/s. This tells us the upper bound for performance as well as whether the program will be compute-bound or memory-bound. This beautiful abstraction is true for any machine based on the Von Neumann architecture, not just GPUs.
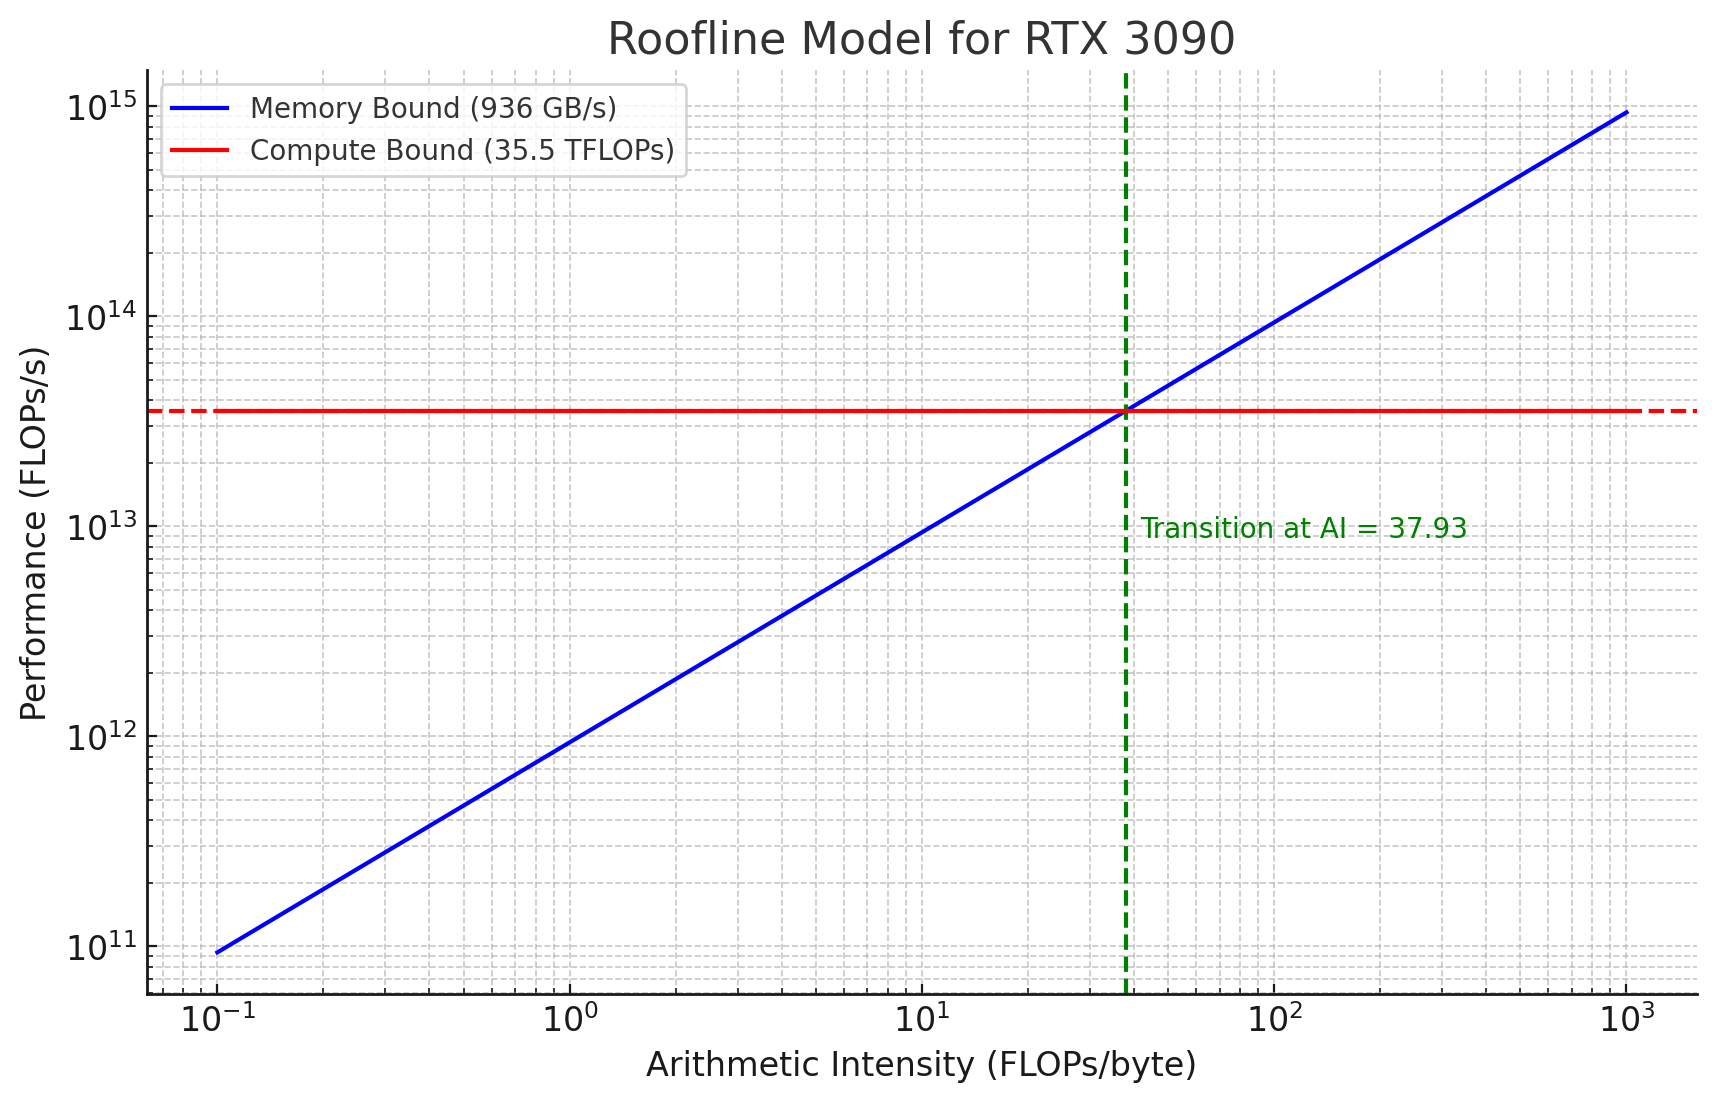
The plot above shows a blue line, which is AI * Mem-Bandwidth, as well as a FLOPS/s line which is horizontal. The point at which the blue line crosses the red-line shows what the arithmetic intensity of a program would need to be to fully saturate the 3090s compute units. We need to perform ~38 operations per loaded byte to get to this point! Lets look at arithmetic intensity for vector addition/matrix multiplication, and quantify their AI.
FP32 Vector Addition (4 bytes per element)
1) Load \(4 N\) bytes for Vector A.
2) Load \(4 N\) bytes for Vector B.
2) Perform ~\(N\) FP32 add operations to add Vector A & B.
3) Store \(4 N\) bytes.
Arithmetic Intensity (AI) is \(\frac{N}{12N}\) operations/bytes or 0.0833.
Vector addition is heavily memory bound, since the arithmetic intensity is so low.
FP32 Matrix Multiplication (all matrix dimensions `N` for simplicity)
1) Load \(4 N^2\) bytes for Matrix A.
2) Load \(4 N^2\) bytes for Matrix B.
3) Perform \(2 N^3\) operations (there are \(N^2\) outputs, each output requires a dot-product of vectors with size \(N\), each dot-product requires ~\(2 N\) additions & multiplies).
3) Store \(4 N^2\) bytes.
Arithmetic Intensity (AI) is `\(\frac{2 N^3}{12 N^2} = 0.167 N\) ops/bytes.
Matrix multiplication is interesting because its AI is a linear function of the sizes of the input matrices. As a result, the program is memory bound at smaller sizes but becomes compute bound at larger ones.
This analysis gives us the ‘light-speed’ for a given program. In reality, we won't load at theoretical bandwidth, we won't compute at theroetical max FLOPs, we may perform more than the ideal number of operations specified during program execution, there will be wind up/wind down effects, etc. By comparing an actual kernel’s effective ops/s to the idealized we can invest our efforts in tackling the right bottle-neck, and better understand how far we are from theoretical limits.
Memory Optimizations
The optimizations below are some of the most important for getting good performance. If the compute units aren’t getting a high throughput stream of bytes to crunch on, the fact that the GPU has an absurd number of compute units won’t matter. [2]
Coalesced and Aligned Global Memory Access [3]
When accessing global memory always do your best to have each thread access sequential addresses where the array is aligned, ideally to 128B (using cuda malloc will default align to 256B). When an RTX 3090 performs a cached GMEM load, it will pull in cache-lines of size 128byte. If a warp (32 threads) accesses 32-bit addresses the entire load can be processed in a single transaction. Deviating from the sequential nature of the access, or misaligning memory in GMEM during kernel launch will reduce effective GMEM utilization.
As we learned in the intro post, unaligned access can either cause
a) excessive pre-charging of row-buffers due to having to pull in multiple DRAM rows
b) excessive memory controller overhead from having to pull multiple cache-lines within the same DRAM row
Both lead to unnecessary overhead. If strided access is necessary, use shared memory as an intermediary to allowing for coalescing.
Use Vectorized Memory Access Instructions [4]
Lines issuing memory loads in CUDA typically compile to a 32-bit (one word) load using the LD.E/ST.E instructions in SASS. If you know the thread will require multiple sequential words of memory, and have a piece of data that is aligned in memory to that multiple, you can issue vectorized instructions to load multiple words in a single transaction. Loading in this way reduces instruction overhead and can be combined with coalescing to improve memory throughput/latency. Vectorized loads are accomplished by using vector data types (float4, float2, int4, int2, etc) and typecasting. An example of a kernel that uses vectorizes loading of two consecutive 32-bit integers is shown below.
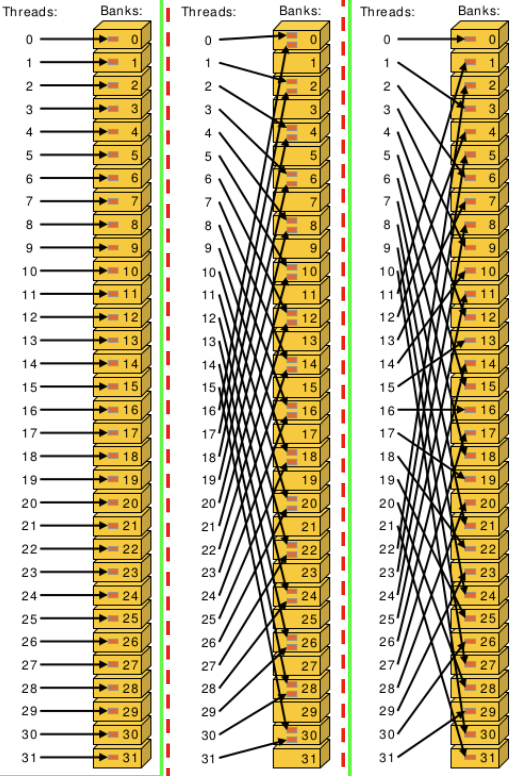
Avoid Shared Memory Bank Conflicts
Shared memory is divided into 32 banks of SRAM cells, with a controller for each bank that can serve 1byte/clock cycle. When multiple threads access a bank simultaneously, these accesses will serialize. The easiest way to avoid shared memory bank conflicts is to access sequential shared memory addresses with each thread within a warp (similar to coalesced GMEM access).
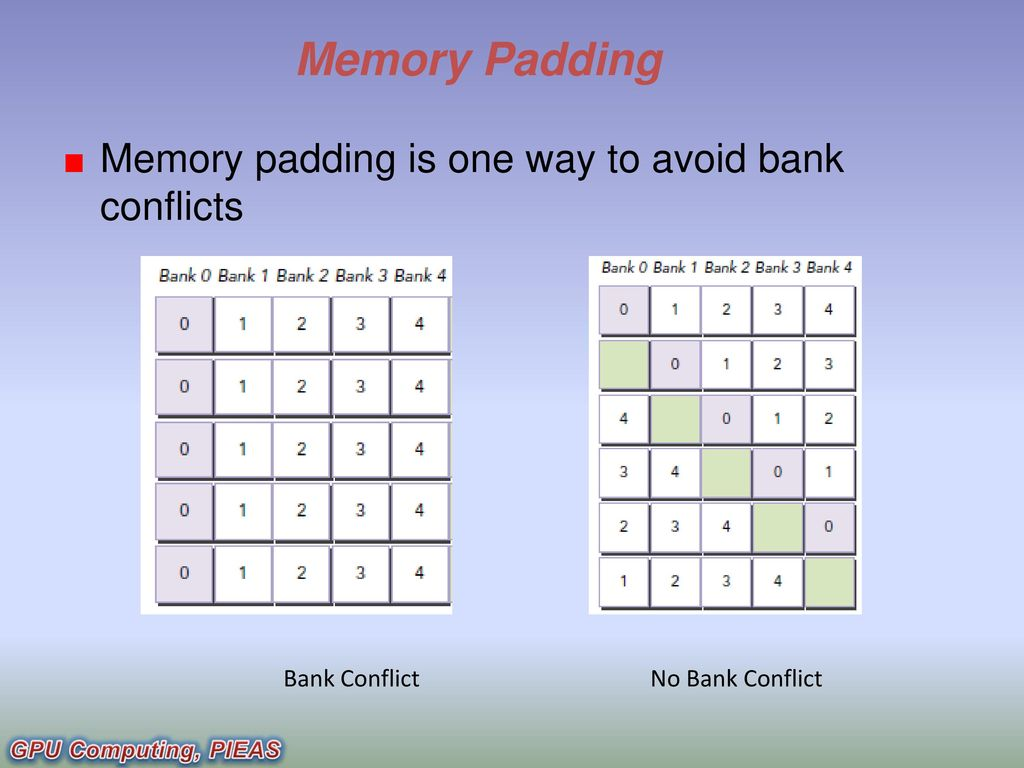
If assigning each thread to a separate bank isn’t feasible, memory padding can be used to introduce an offset that eliminates the conflict. The padding is at the cost of higher shared memory utilization per block which may impact occupancy.
Keep Re-Used Data in the fastest Memory Stores
Many operations involve data re-use. When performing a matrix multiplication for example, we load 2N^2 elements, but perform 2N^3 operations, meaning each element has N operations associated with it. It would be extremely wasteful to go back to global memory for each of the N operations. When performing operations with the same data multiple times, consider keeping it in shared memory or thread registers. Simon Boehm's post on optimizing GEMM makes heavy use of this method and I would highly reccomend giving it a thorough read. NVIDIA GPUs also have constant and texture memory, which to be totally honest I have not used. But from what I understand, these stores are read-only and can provide efficient access if many threads will need to access the same memory address many times [7]. When initially thinking about kernel architecture, spend a fair amount of time understanding the graph of memory dependencies for each output element that your kernel produces. Visualizing this graph can provide a clearer picture of what bytes should be put where.
Avoid Register Spilling [8]
GPUs have a maximum number of registers that can be allocated to each thread. When a thread violates this limit (255 for RTX 3090), the data will spill to ‘local memory’ which is actually just a section global memory set aside for that thread! If we are lucky, L2 cache will intercept the read/writes and we won’t have to pay full latency associated with GMEM. But if we are not careful, we can inadvertently perform tons of slow GMEM accesses and delude ourselves into thinking we are using fast thread registers. When compiling a CUDA kernel, you can add ‘-Xptxas -v’ to your nvcc command to see a print out of register use per thread and make sure you aren’t close to any limits.
Compute Optimizations
Getting bytes to compute units efficiently is important, and so is make sure the compute units themself are adequately saturated with arithmetic instructions that operate on the incoming bytes. [2]
Maximize Number of Active Warps (Occupancy) [9]
I mentioned in the previous post that its up to us to make sure all of compute units are executing useful operations during the course of the kernel execution. This can be done by thinking carefully about memory resources and thread count in each block, since this is the fundamental limiter to how much warps can be active at the same time. On an RTX 3090, each SM can support:
Notice that while the number of max active threads is 1536, there are only 128 CUDA cores on an SM. Whats happening here is the warp scheduler tries to make as many warps ‘active’ as possible by assigning them the registers and shared memory they request. When warps are stalled due to memory latency, the scheduler can swap active threads in and out of CUDA cores to make sure the hardware is fully utilized. This is what occupancy measures: how many of the maximum possible active warps are able to be added to the pool of warps ready to run on a core? In this way the GPU hides memory latency by oversubscribing the hardware. The GPU can only oversubscribe if its fed kernels that make availiable blocks with the appropriate number of threads/warps, and don’t hog all the registers/shared memory. While low occupancy will certainly hurt performance, high occupancy doesn’t guarante compute unit saturation. According to this post on NVIDIA forums, 50% - 75% occupancy is usually acceptable. Also note that while per SM occupancy is important, we also want to saturate all SMs with work. There are 84 SMs on an RTX 3090 so we need atleast 84 blocks to make sure each has something to do.
Use Tensor Cores & FMA Units [14] [15]
Tensor cores are designed specficially to accelerate matrix-multipy-accumulate operations on GPUs. Use them whenever an operation can be represented as an MMA. On a similar grain of thought, scalar-multiply-accumulates are also hardware accelerated and can be called using the fmaf() function in CUDA. The NVCC compiler typically optimizes operations of the format ‘a = a + (b*c)’ into FMA instructions anyway but using the function call can make this explicit. One thing to keep in mind though, is they don’t benefit memory-bound workloads. For example, a convolution can be performed as an implicit GEMM in order to utilize tensor cores, but the memory overhead of the transforms needed to achieve this may far outweigh efficiency gains from tensor core utilization for low arithmetic intensity workloads. Don’t worry if this statement is confusing for now, future posts go into roof-line models and their implications.
Minimize Warp Divergence [10]
When each thread in a warp of 32 threads executes, control flow overhead is minimized when each thread is performing the exact same operation as the same time. Certain types of data-dependent control flow can cause this to no longer be the case. In these situations, the threads will effectively split into multiple diverged execution paths, with each chunk executing independent of each other. Obviously this hurts hardware utilization as we are running fewer than 32 threads per warp. Try to minimize warp divergence to the extent possible by making sure all threads in a warp will follow the same execution path.
Unroll Loops [11]
When CUDA code is compiling to PTX, loops with loop counts that are defined at compiled time will get unrolled. Unrolling eliminates overhead associated with checking loop conditionals/incrementing loop count and enables instruction level parallelism in the case of loops that unroll to multiple indepedent instructions. Lets take a look an example with a simple for-loop. We can hint to the compiler to unroll a loop by using ‘#pragma unroll’. Appending an integer after pragra unroll tells the compiler how many to iterations to unroll. By putting a 1 after pragma unroll we can effectively prevent the compiler from unrolling the loop.
Standard Loop CUDA
Standard Loop PTX
$L__BB0_1:
        cvt.rn.f32.s32  %f4, %r5; //convert value in r5 to float and move to f4
        add.f32         %f5, %f5, %f4; //add value from f4 to f5 and store in f5
        add.s32         %r5, %r5, 1; //increment loop counter in r5 by 1
        setp.ne.s32     %p1, %r5, 10; //compare loop counter (r5) to 10 and set predicate register p1 to True if it is
        @%p1 bra        $L__BB0_1; //branch conditionally based on the value in p1

        st.global.f32   [%rd1], %f5;
        ret;
Unrolled Loop PTX (CUDA code uses #pragma unroll instead of #pragma unroll 1)
add.f32         %f2, %f1, 0f00000000;
add.f32         %f3, %f2, 0f3F800000;
add.f32         %f4, %f3, 0f40000000;
add.f32         %f5, %f4, 0f40400000;
add.f32         %f6, %f5, 0f40800000;
add.f32         %f7, %f6, 0f40A00000;
add.f32         %f8, %f7, 0f40C00000;
add.f32         %f9, %f8, 0f40E00000;
add.f32         %f10, %f9, 0f41000000;
add.f32         %f11, %f10, 0f41100000;
st.global.f32   [%rd4], %f11;
ret;
Note that in the unrolled case the compiler turned the loop into 10 distinct add.f32 instructions, and derived the constant values based on the loop count at compile time. This change eliminates loop related overhead. In this case there is a dependency between each instruction but in some cases independent instructions resulting from unrolling can also allow the thread to utilize greater instruction level parallelism. The CUDA compiler is quite good at spotting loops that can be unrolled but throw in a ‘#pragma unroll’ for loops you think could benefit from unrolling.
Use Signed-Ints for Loop Counters [12]
Unsigned integers have defined overflow behavior as they are expected to loop back around, whereas signed ints result in undefined behavior at runtime. Ensuring the former holds true reduces the compiler’s ability to optimize loop execution. As a result you may see a small pef improvement in hot-loops by using signed-ints for loop counters.
Use Fast Math Library (when precision isn’t critical) [13]
CUDA provides a pretty extensive math library for operations that execute on the special functions unit. Some examples of functions include - sin(x), cos(x), log(x), exp(x), etc. If you don’t care as much about precision and can accept some rounding errors (SIDE BAR ABOUT HOW INT8 works so rounding errs prob fine), using the fast version of these calls can improve performance. Examples - __sinf(x), __cosf(x) vs. sin(x), cos(x)
Maximize Instruction Level Parallelism via Dual-Issue Instruction Dispatch
According to discussion in this thread, dual-instruction dispatch on NVIDIA GPUs isn’t a huge driver of improved performance and not worth too much thought. But it is worth noting that the warp scheduler can issue up to two instructions per cycle IF the are multiple instructions with no data or control flow dependencies. Writing a kernel such that there are fewer dependencies and diversity in the types of execution units being used (FP32/tensor core/load-store units/etc) may enable higher instruction dispatch per cycle.
References
[1] https://people.eecs.berkeley.edu/~kubitron/cs252/handouts/papers/RooflineVyNoYellow.pdf
[2] https://docs.nvidia.com/cuda/cuda-c-best-practices-guide/contents.html
[3] https://developer.nvidia.com/blog/how-access-global-memory-efficiently-cuda-c-kernels/
[4] https://developer.nvidia.com/blog/cuda-pro-tip-increase-performance-with-vectorized-memory-access/
[5] http://homepages.math.uic.edu/~jan/mcs572f16/mcs572notes/lec35.html
[6] https://slideplayer.com/slide/12553635/
[7] https://docs.nvidia.com/cuda/cuda-c-best-practices-guide/index.html#constant-memory
[8] https://developer.download.nvidia.com/CUDA/training/register_spilling.pdf
[9] https://on-demand.gputechconf.com/gtc-express/2011/presentations/cuda_webinars_WarpsAndOccupancy.pdf
[10] https://people.maths.ox.ac.uk/gilesm/cuda/lecs/lec3-2x2.pdf
[11] https://docs.nvidia.com/cuda/cuda-c-best-practices-guide/index.html#branch-predication
[12] https://docs.nvidia.com/cuda/cuda-c-best-practices-guide/index.html#loop-counters-signed-vs-unsigned
[13] https://docs.nvidia.com/cuda/cuda-c-best-practices-guide/index.html#math-libraries
[14] https://developer.nvidia.com/blog/programming-tensor-cores-cuda-9/