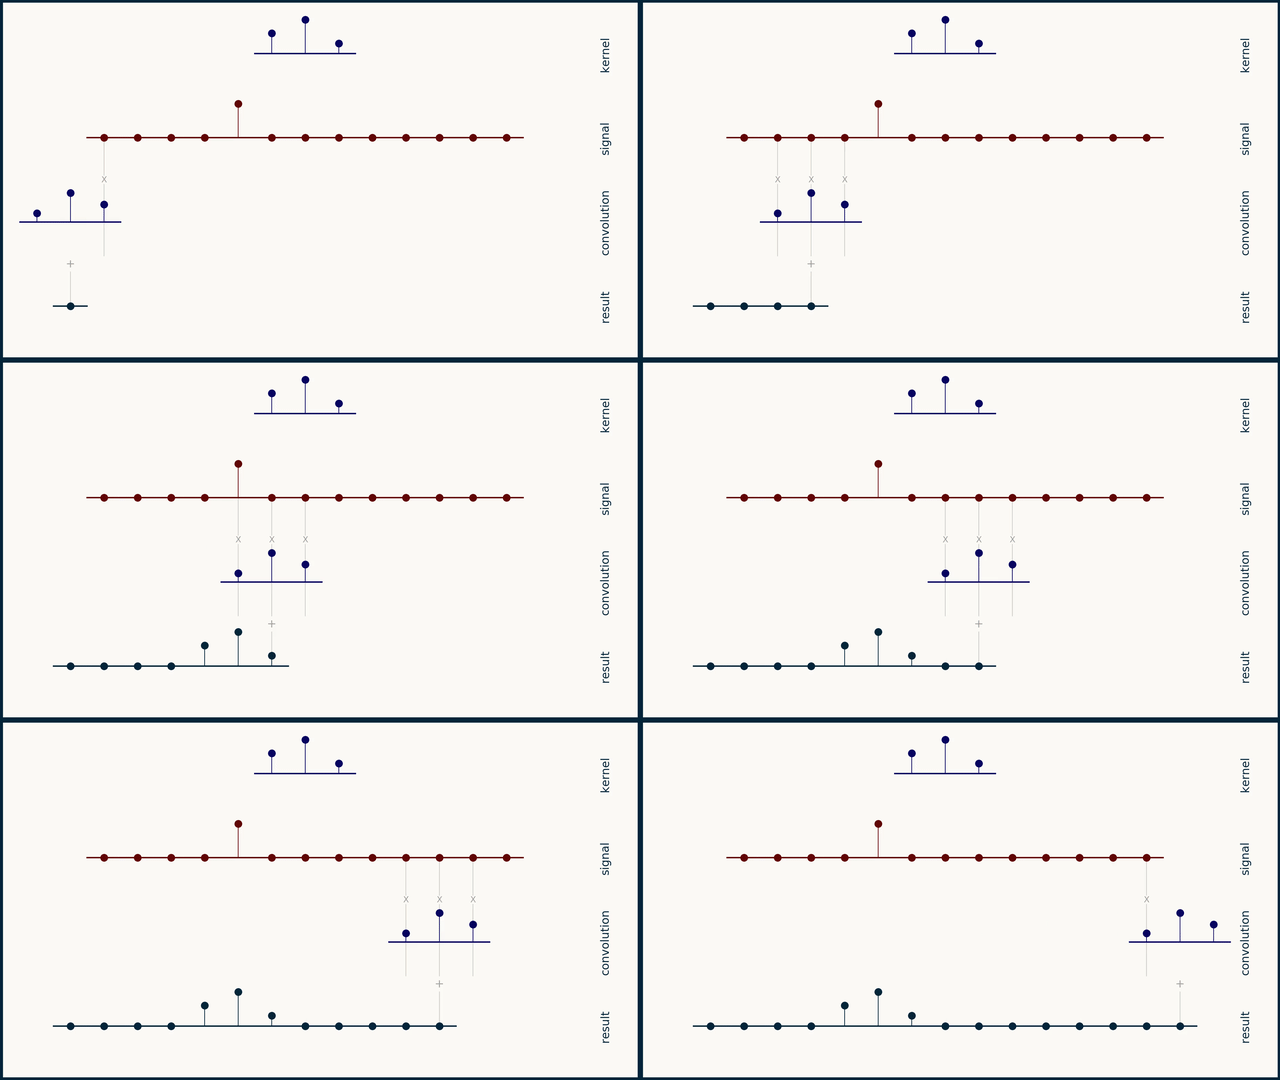
Before going into the code and compute profiles for a 1D convolution kernel, lets take a step back to quickly go over what a 1D convolution is. Note: if you have the time, watch ThreeBlueOneBrown's video on convolutions, it's much better than what I have here! Convolution involves taking an input vector (or matrix in the 2D case), a kernel, and sliding the kernel over the input vector while taking a vector dot product between the two at each step. Depending on the kernel values this can result in many useful outputs, such as the average value in the window at each step (if each element in the kernel is 1/kernel_length), or a Gaussian blur (if the kernel is normally distributed).

Of course in our case the kernel values are learned and represent values that achieve the lowest loss on the training set. Important parameters for a 1D convolution are
- input_length - length of each input vector.
- padding - how many zeroes are appended to the beginning and end of the input. modulating this controls the length of the output.
- kernel_size - length of the kernel being slid across the input.
- input_channels - the number of rows in the input tensor.
- output_channels - the number of rows in the output tensor.
Typically the weight tensor for each 1D Conv layer has format (output_channels, input_channels, kernel_size) and bias is a vector of the same length as the number of output_channels. You can visualize each output_channel being calculated as the result of a kernel of size (input_channels, kernel_size) sliding over the input of size (input_channels, input_length).
Our first pass at a GPU kernel will involve mapping blocks/threads as follows.
- Each block will be responsible for calculating one row in the output. This allows all reductions arising from the weight tensor sliding over the input tensor to happen local to each SM. Splitting a single output over multiple blocks would also entail loading the same weight matrix from global memory multiple times, which is undesirable.
- Each thread will be responsible for performing a convolution for one row in the input. The dot-products associated with sliding each input_channel’s kernel over it results in a lot of memory reuse that can happen inside fast thread registers.
With this partitioning of work in mind, lets dive into the CUDA code. We start by templating a handful of variables so we can flexibly dispatch a function call to the right kernel at run-time. CUDA support for dynamic memory allocation is a bit tricky, so I have typically used template arguments for this. The function definition is pretty straight forward, taking in pointers to relevant inputs and an integer for the number of input channels. We don’t need to make input_channels a templated parameter because it doesn’t get used for memory allocation. We define two constant integers that we will refer to throughout the program: padded_input_length and weight_offset. Padded input length is the sum of input_length and double the padding (since we pad the front and back of the input vector). Weight offset is an integer that calculates the offset within the weight tensor for this block. Since each output_channel has its own chunk of memory that is input_channels * KernelSize in length, we offset by this distance times the output_channel that this block is responsible for (blockIdx.x).
Next, we load the input vector and kernel associated with the work this thread is responsible for. We start by allocating thread registers of size padded_input_length, and KernelSize. The next two loops initialize the registers that store the input vector with 0s, and then load the relevant input from global memory. The last loop loads the weights into registers assigned to the kernel for this row.
This next chunk of code is where the actual convolution happens. The outer loop that has a loop counter of ‘tileIdx’ is a bit deceptive as it iterates up to InputLength, but results in the calculation of the output at each index. For this U-Net, the input length is always the same as the output length which is why the loop counter upper bound is what it is. Within each iteration of the outer loop:
- each thread calculates the dot-product between the kernel at each position and the input vector
- each thread stores the resultant scalar to shared memory, using its thread index as the index to store at
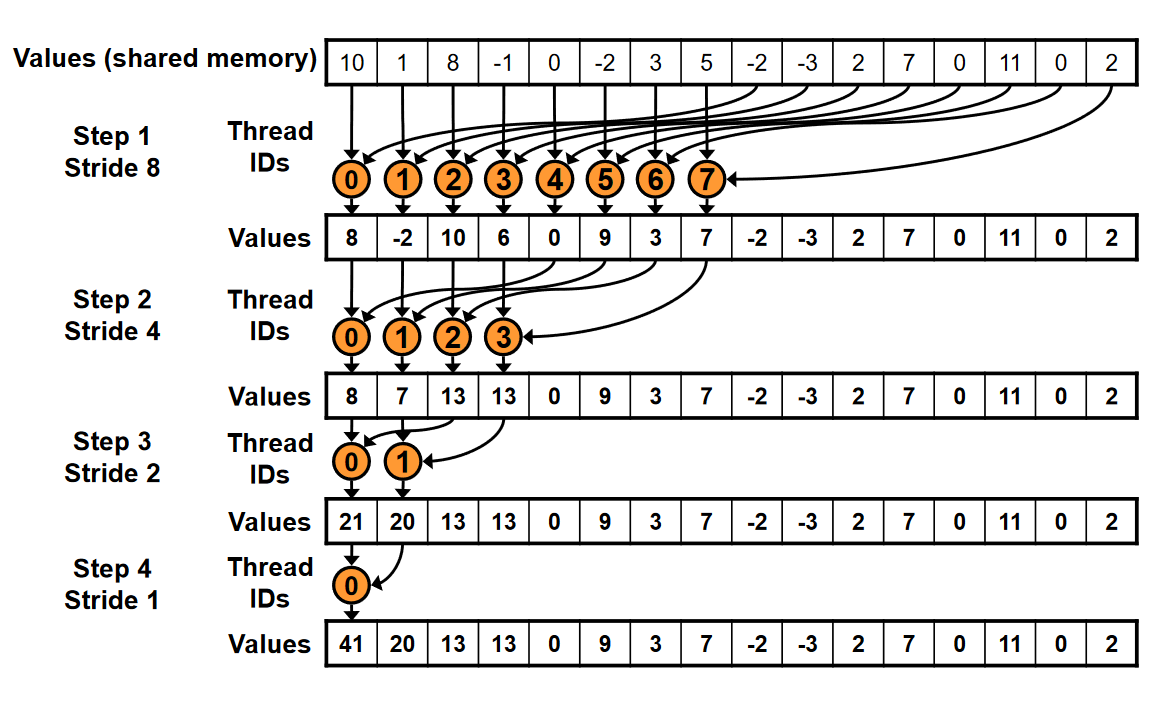
- we perform a parallel reduction using all the values in shared memory in order to calculate the sum for all the dot products at this position. this loop may look a bit unituitive but the visual below should hopefully make things more clear. we start out leveraging half the threads in the block to sum the values at their current index and the value at their index + the loop counter. at each iteration the number of threads participating halves using a bitshift, until eventually the last two threads write the final result to index 0.

- finally, thread 0 writes the sum of the resultant output and the bias for this position to the appropriate index of the output
This code is pretty close to what my first pass for this kernel was and this is actually already a bit faster than Pytorch’s 1D Convolution operation (parameters: input_channels = 1024, output_channels = 1024, input_length = 4, kernel_size = 5, padding = 2)! There is a lot we did here that isn’t best practice for GPU programming though, and we can use Nvidia’s awesome Nsight Compute profiler to get a deeper understanding of how our code is performing. A high level summary shows our kernel….sucks. The generated roofline plot shows we achieve ~423 GFLOPs which is only ~20% of the theoretical max at this arithmetic intensity. Thankfully Nsight Compute provides lots of areas for improvement.

The arithmetic intensity the plot below shows was calculated based on this specific kernel, and is not the theoretical upper bound for a 1D Convolution. So we can also move further to the right on this plot by being more efficient with each byte loaded from GMEM.
Poor Memory Access Patterns

Under the memory workload analysis we see that we are pulling in ~576 bytes of data per memory request, whereas an optimal access pattern would only need to pull in 128 bytes per request. This actually makes sense, since we are making strided global memory requests with a stride of ~4. These strided requests result in wasted data for each 128B cache line pulled from global memory. In the source counter section, NCU actually maps the lines in our kernel resulting in the uncoalesced requests (possible since I compiled with —lineinfo flag).

The offending lines, as we would expect, are the strided loads from GMEM into thread registers for our input/kernel weights.

Occupancy Lower than Theoretical Max

Our kernel only results in 8 out of the 12 possible active warps per scheduler. Recall that each SM has a limit of 48 warps (or 12 warps on each of the four schedulers). Our blocks are each of size 32 warps, preventing multiple blocks from being active concurrently and resulting in lower than maximum occupancy. From what I have read 66% isn’t necessarily bad.
Excessive Warp Stalls

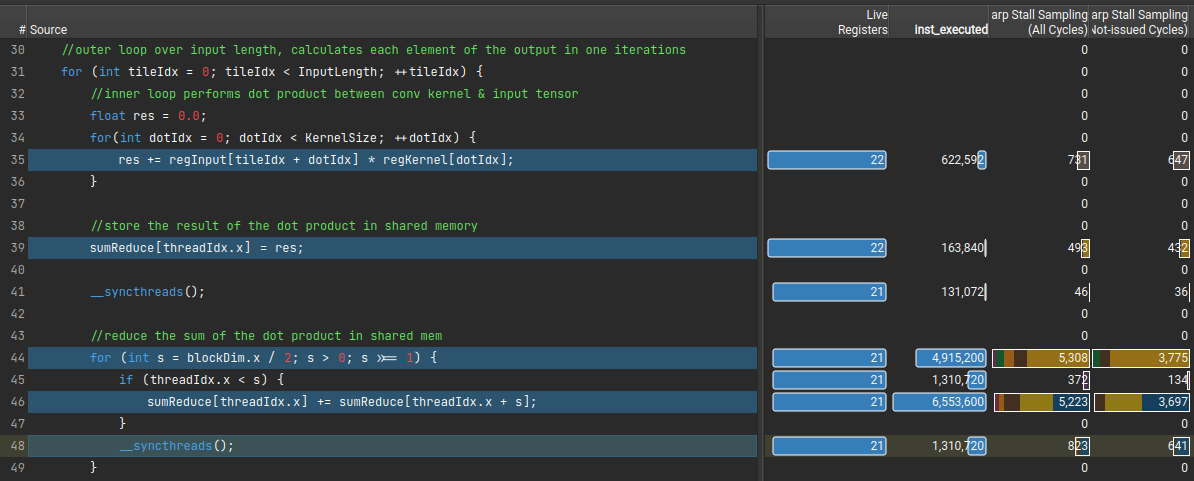
On average there are 22 cycles between each issued instruction for each warp. Given that we have 8 active warps per scheduler and 22 cycles between each warp being able to issue an instruction, we are spending a fair number of cycles without firing off instructions. This also explains the 0.35 issued warp per scheduler (7.96 active warp/22.7 cycles per issued instruction) from the previous section. Looking at the actual warp stall counts line-by-line, we see that lines 35, 39, 44, 46, and 48 are responsible for the majority of warp stalls in the kernel. Lets try to figure out why these lines are resulting in warp stalls.

Line 35
compiles into PTX instructions
The PTX above represents the unrolled version of the inner dot-product loop, with each fused-multiply-accumulate in a loop-interation turning into a single instruction. The stall reason for these instructions is ‘Long Scoreboard’, which indicates that warp’s trying to run this instruction ran into unfulfilled global memory dependencies. This makes sense since there isn’t a ‘sync_threads’ in between the last global memory load sequence and the fma instructions that necessitates registers to contain data from GMEM. We could likely reduce this stall reason by improving our memory loading scheme.
Line 39
compiles into PTX instruction
The stall reason associated with the st.shared.f32 instruction is ‘barrier’. This is because the instruction directly succeeding the shared memory store is ‘syncthreads’, so some warps are completing the shared memory store before others and hitting barrier stalls waiting for everyone to finish. We can address this by trying to come up with a way to complete the sum-reduce without introducing dependencies between warps.
Line 44
compiles into PTX instructions (for the first loop iteration)
This sequence of instructions iterates the loop counter and checks to see if the loop is over or not. The vast majority of stalls show up as ‘barrier’ stalls associated with the ‘@%p1 bra $L__BB0_5;’ instruction. If you imagine how the sum-reduction takes place, at every iteration the number of threads participating in the reduction are cut in half. If we had 1024 threads to start, only 512 participate in the first iteration, only 256 in the second, only 128 in the third, and so on. The threads that do not participate are stuck in this loop due to the ‘sync_threads’ and hit barrier stalls while waiting for the participating threads to complete. To be super honest though I am not sure why barrier stalls are associated with this line and not the conditional ‘if (threadIdx.x < s)’ in the succeding line. This stall reason could be addressed by reducing the total number of threads participating in the reduction, unrolling the loop iterations once the number of participating threads is smaller than 32, or finding a way to remove the ‘sync_threads’ all together.
Line 46
compiles into PTX instructions
The warp stall causes for line 46 are largely due to MIO throttles during the shared memory loads/stores as well as short scoreboard stalls during the fp32 add. The MIO throttles are due to the instruction queue in the load/store units getting overwhelmed from the number of simultaneous shared memory instructions. The short scoreboard stalls are in a somewhat similar family, and are caused by thread registers data dependencies not being met due to long shared memory access times. We could address these by eliminating our dependency on shared memory, reducing the number of warps participating in the reduction.
Line 48
compiles into PTX instructions
This instruction stalls mostly for ‘mio throttles’, similar to the shared memory loads and stores from earlier. Given that the instruction directly preceding is a shared memory store, I think these stalls are spill-overs from the st.shared.f32.
Combing through our NCU profile, we walk away with a handful of areas of improvement for our 1D Convolution kernel.
1) Improve global memory loading scheme to eliminate strided loads.
2) Address stalls related to thread synchronization and shared memory utilization. Some avenues to do this include:
-eliminate or reduce the number of synchronization-barriers
-reduce the number of threads participating in a synchronized reduction
-find a way to perform the reduction without using shared memory